Portable UV Station and Data Logger
A portable embedded UV station and data logger developed for SEE712 Embedded Systems, combining environmental sensing, GPS timestamping, LCD-based user interaction, EEPROM logging, custom PCB integration, and a radar-station-inspired enclosure.
Project Overview
Project Overview
This project involved the design and development of a portable embedded monitoring station capable of recording UV level, light level, GPS location, and timestamp data. The system was developed for SEE712 Embedded Systems as a compact Arduino-based data logger with onboard user feedback and later data analysis in MATLAB.
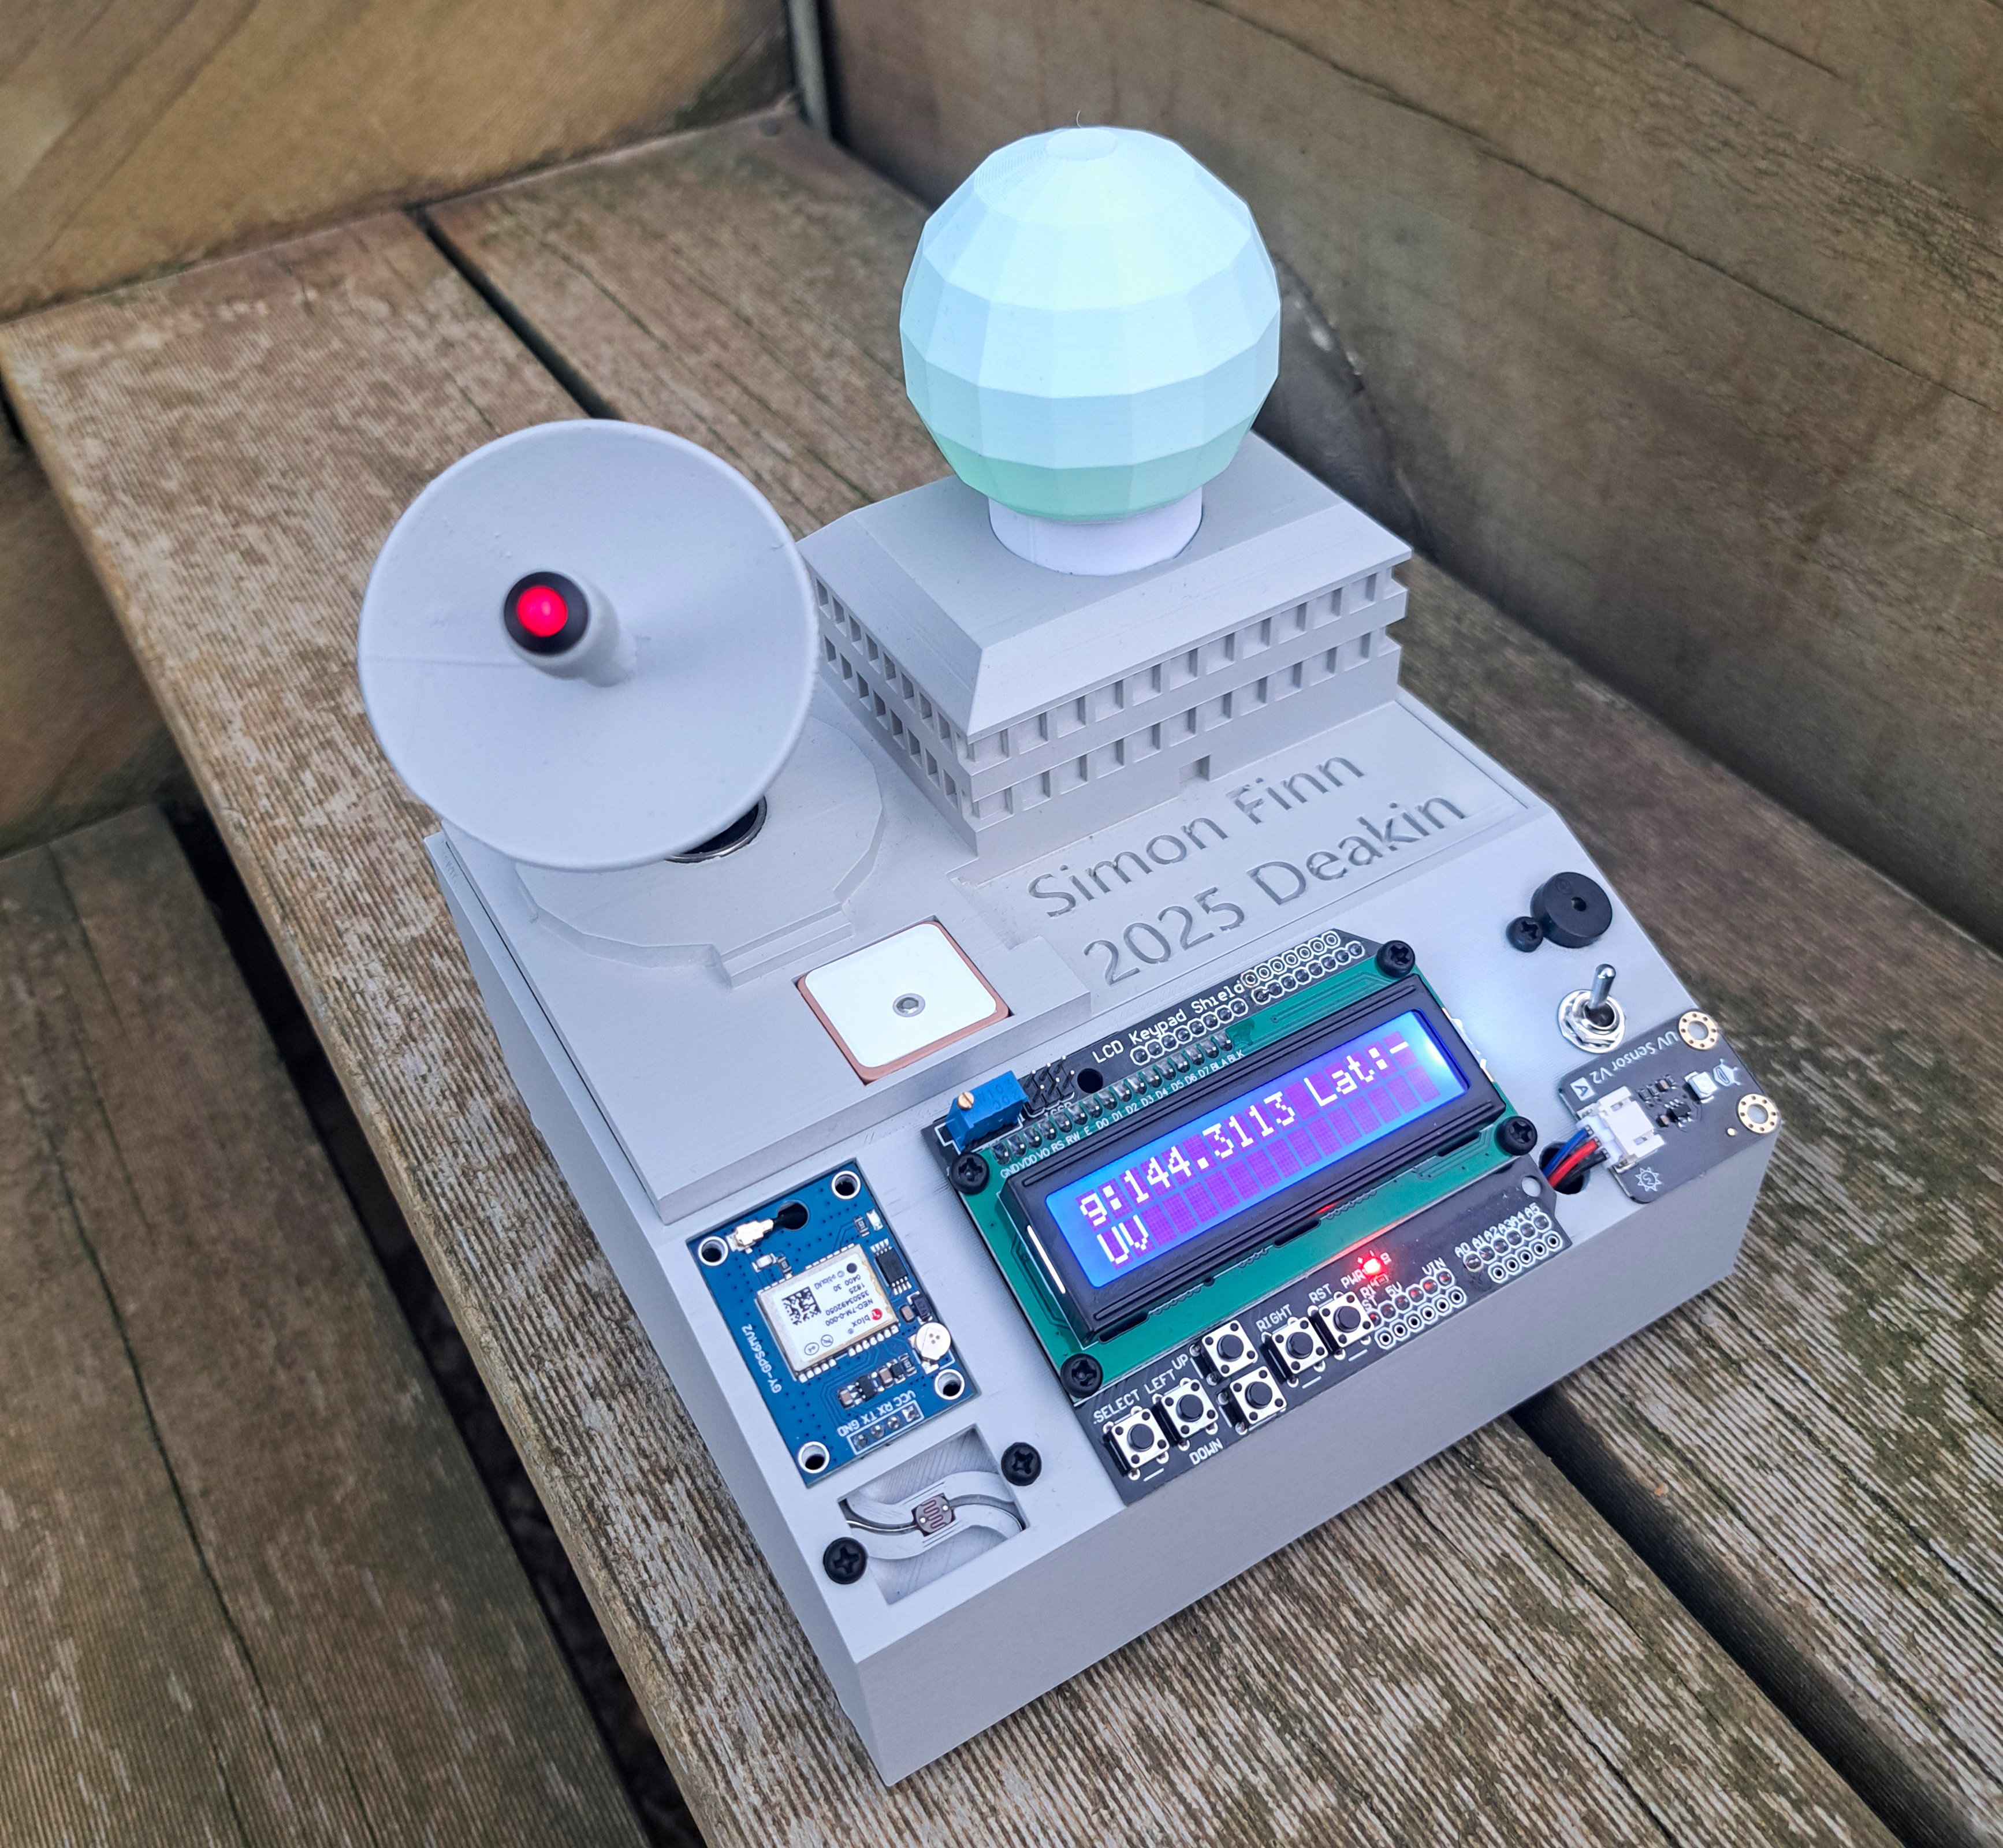
The final system combined an Arduino Mega Pro, DFRobot UV sensor, NEO-7M GPS module, LDR light sensor, 16x2 LCD interface, buzzer, RGB LED, servo-driven radar dish, custom PCB, and 2S LiPo battery. The result was a self-contained portable station that could be placed outdoors to collect localised environmental readings throughout the day.
Beyond meeting the base embedded systems requirements, the project included several additional features: a custom enclosure inspired by weather radar stations, a moving satellite dish aesthetic, a custom PCB for cleaner wiring, and a user interface with multiple LCD screens for viewing sensor values and adjusting the UV threshold.
Project Purpose
The project was designed around the idea of a small localised monitoring station that could gather useful environmental data without needing a full-scale weather station. By pairing UV and light level measurements with GPS location and timestamp information, the system could produce a dataset that was both measurable and traceable.
The core aim was not to build an industry-grade weather instrument, but to demonstrate embedded system principles through practical hardware and software integration. This included direct sensor reading, LCD control, user interaction, periodic data logging, hardware packaging, and evaluation of recorded data.
Key Features
Portable Embedded Hardware
The station was built around a compact Arduino Mega Pro, selected to provide the functionality of an Arduino Mega in a smaller physical form factor. This allowed the system to support the required peripherals while still fitting inside a compact portable enclosure.
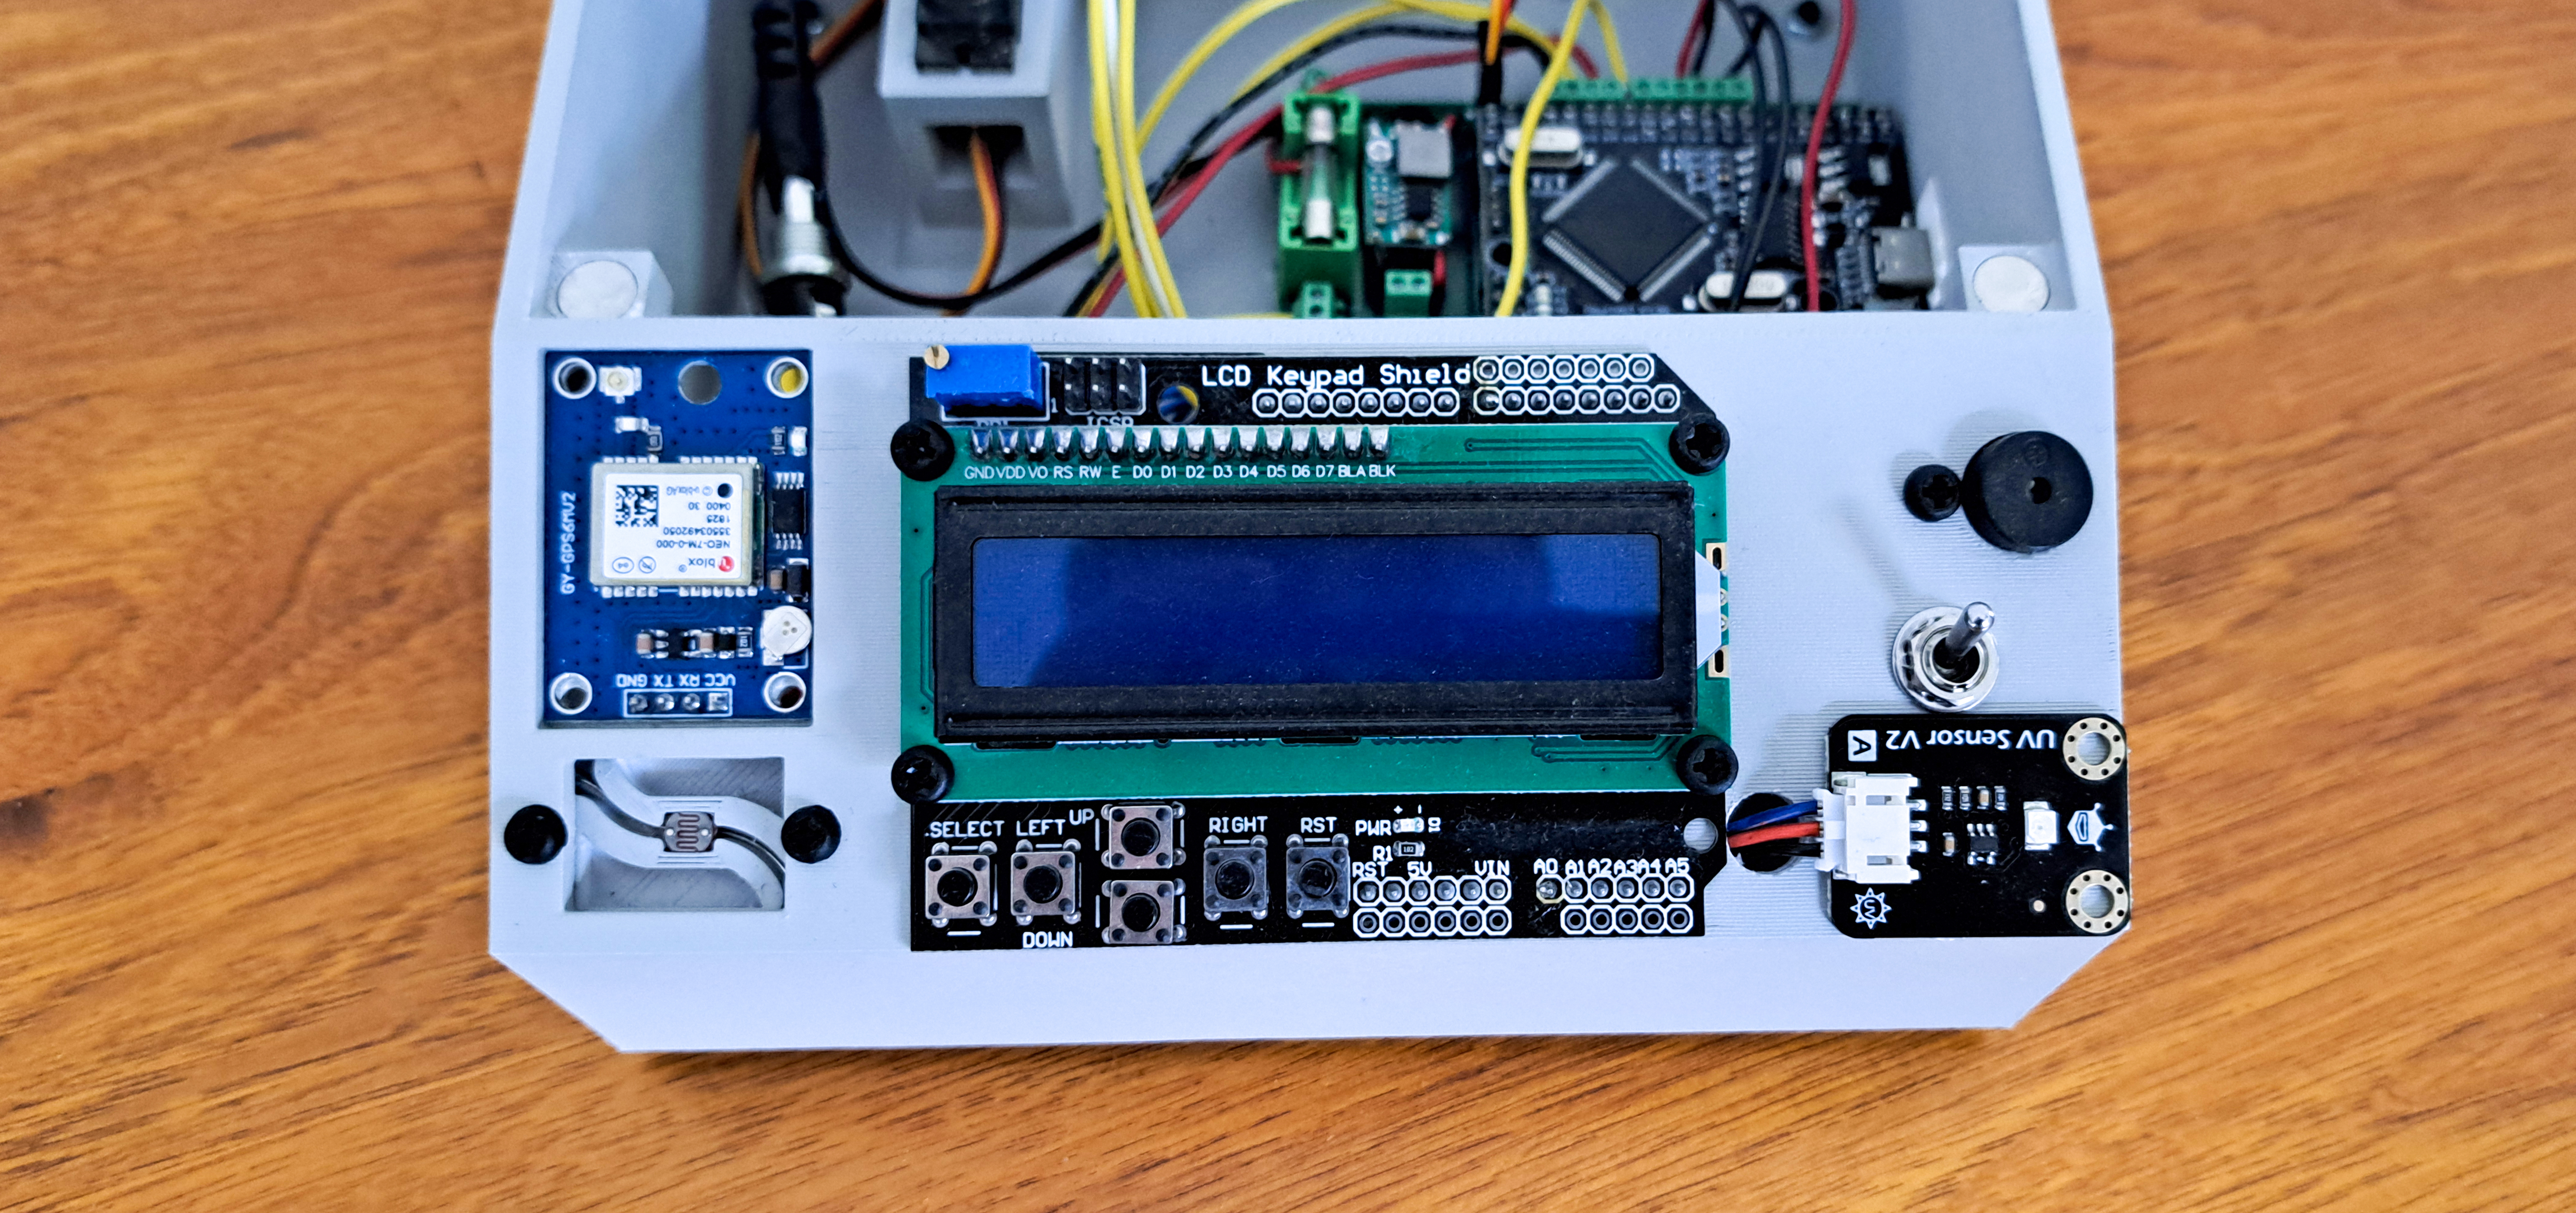
The hardware included a UV sensor for measuring current UV conditions, an LDR for recording light level, a NEO-7M GPS module for location and timestamp information, a 16x2 LCD for user feedback, a piezo buzzer for alerts, and LEDs for visual indication.
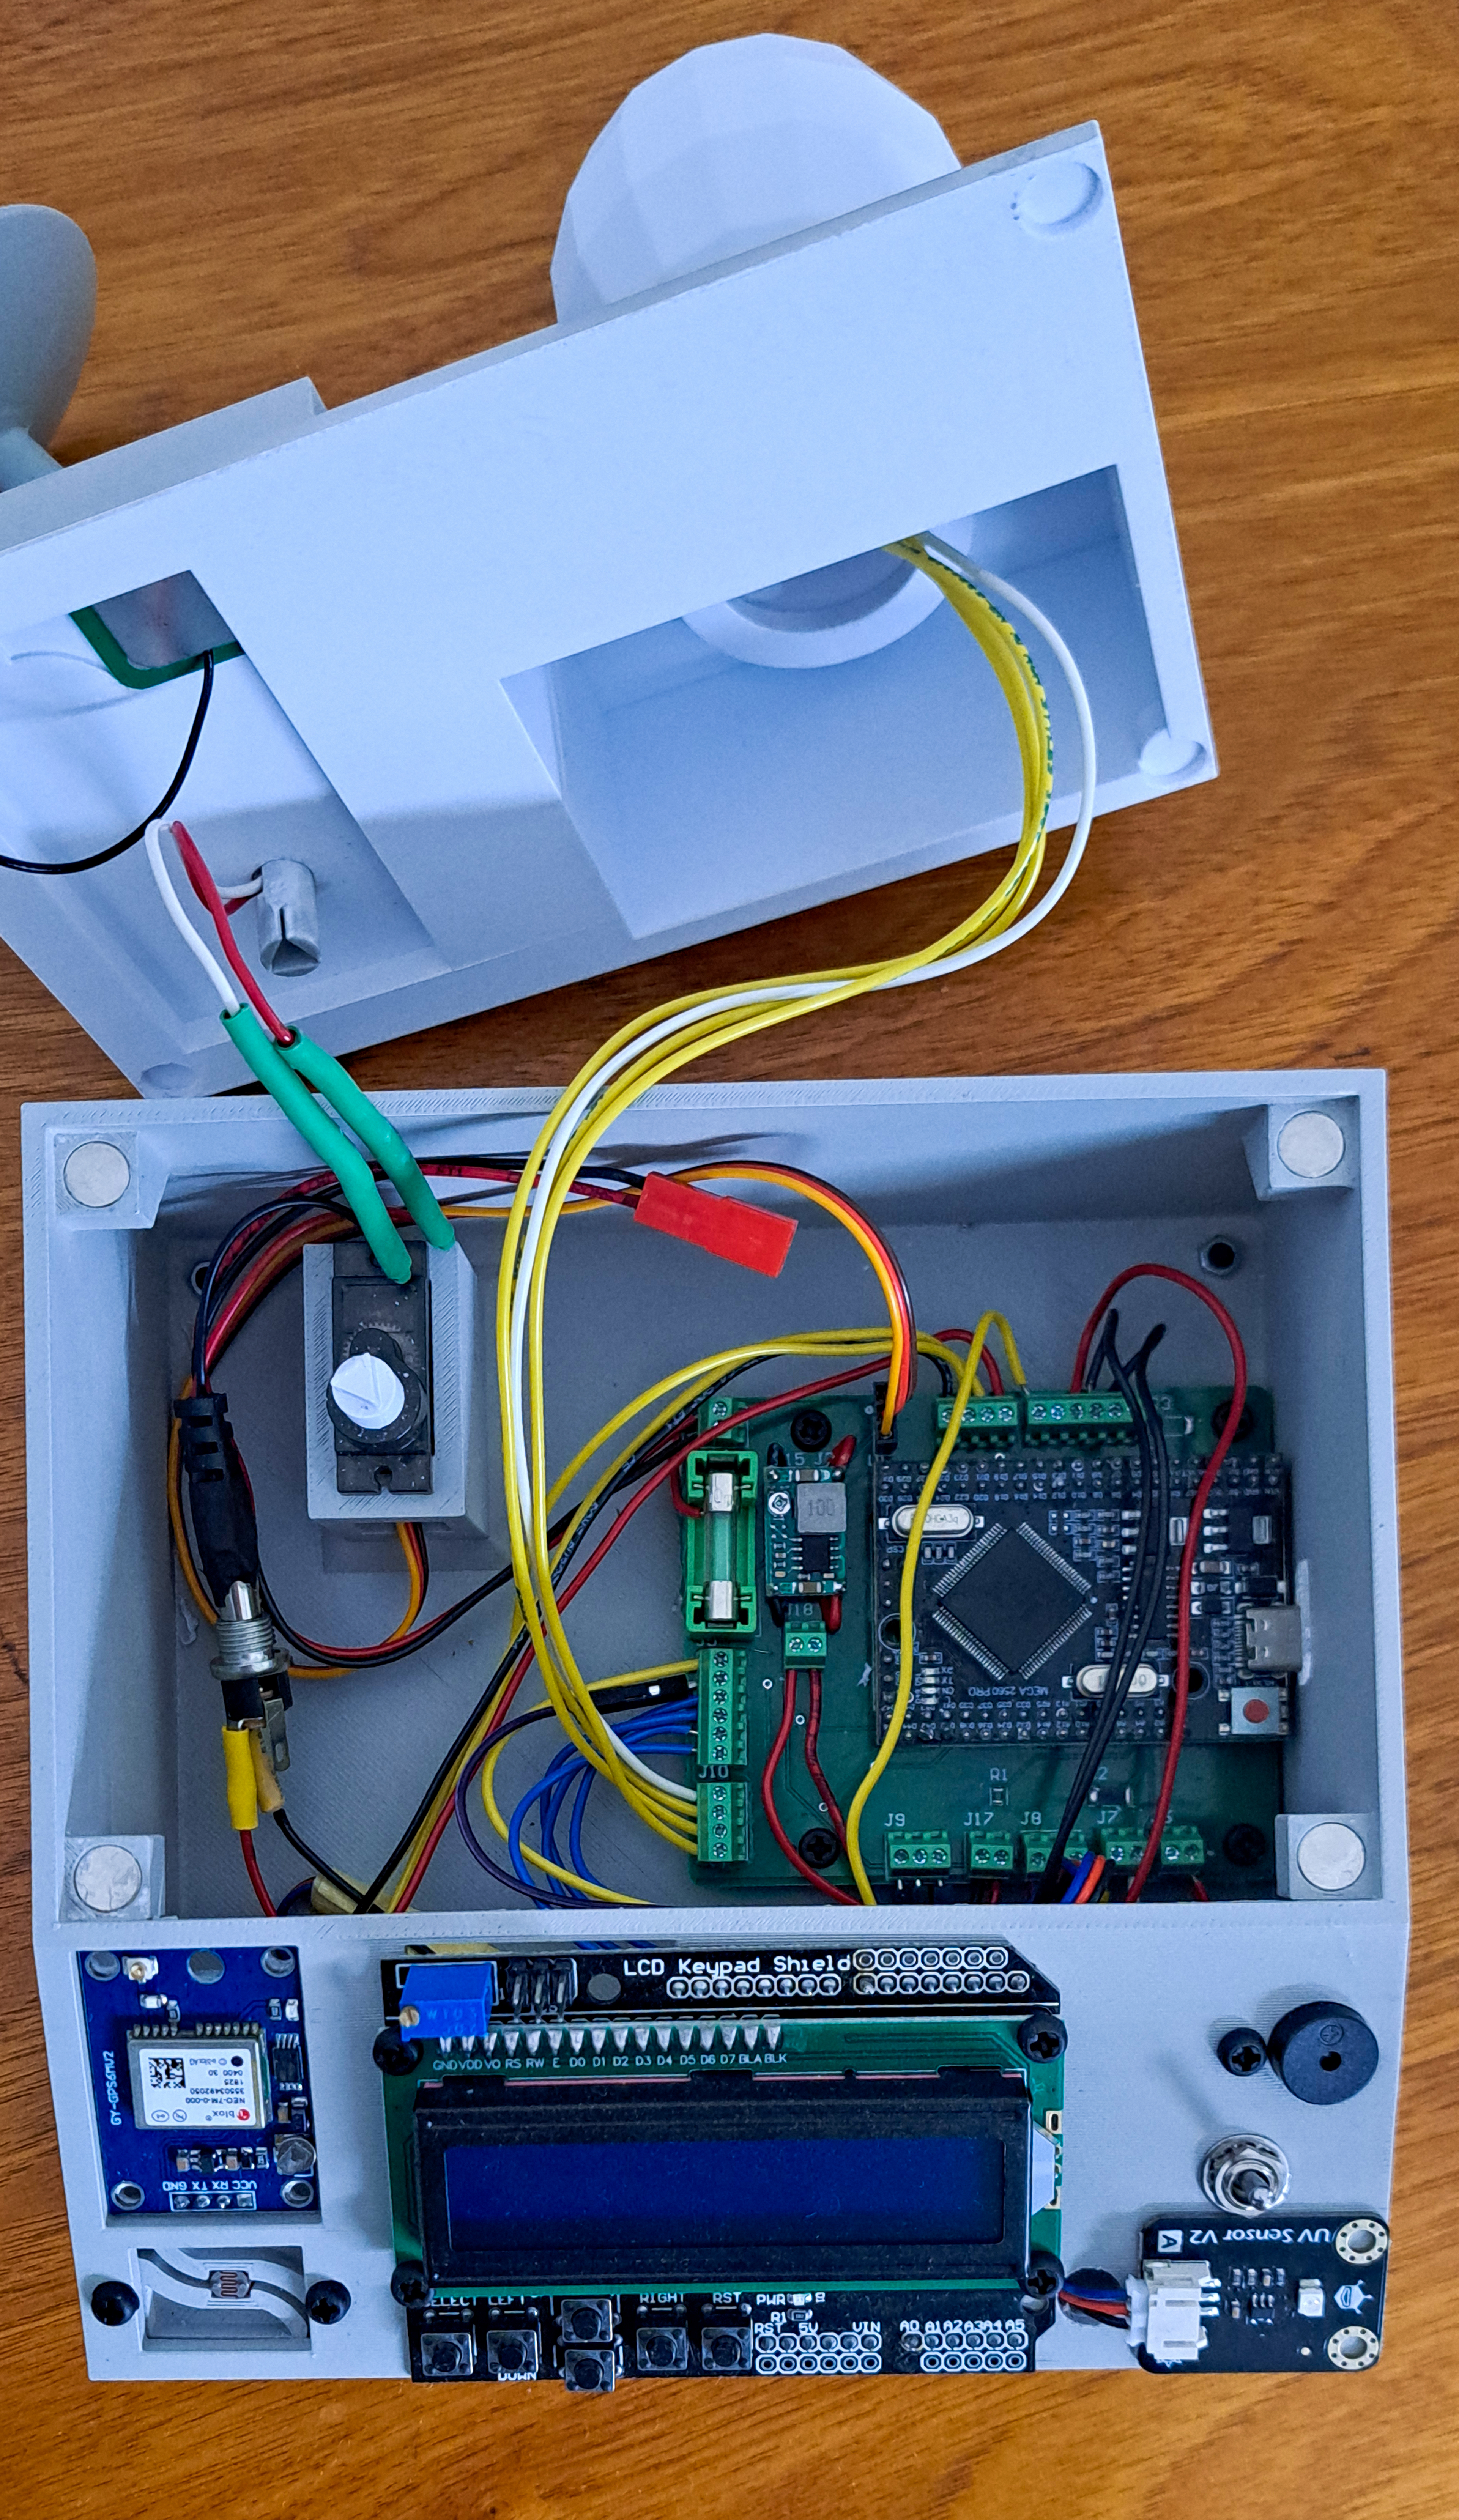
A 2S LiPo battery, fuse holder, and switch were included to make the station portable and safer to operate during testing. This allowed the device to be used away from a computer while collecting outdoor data.
LCD User Interface
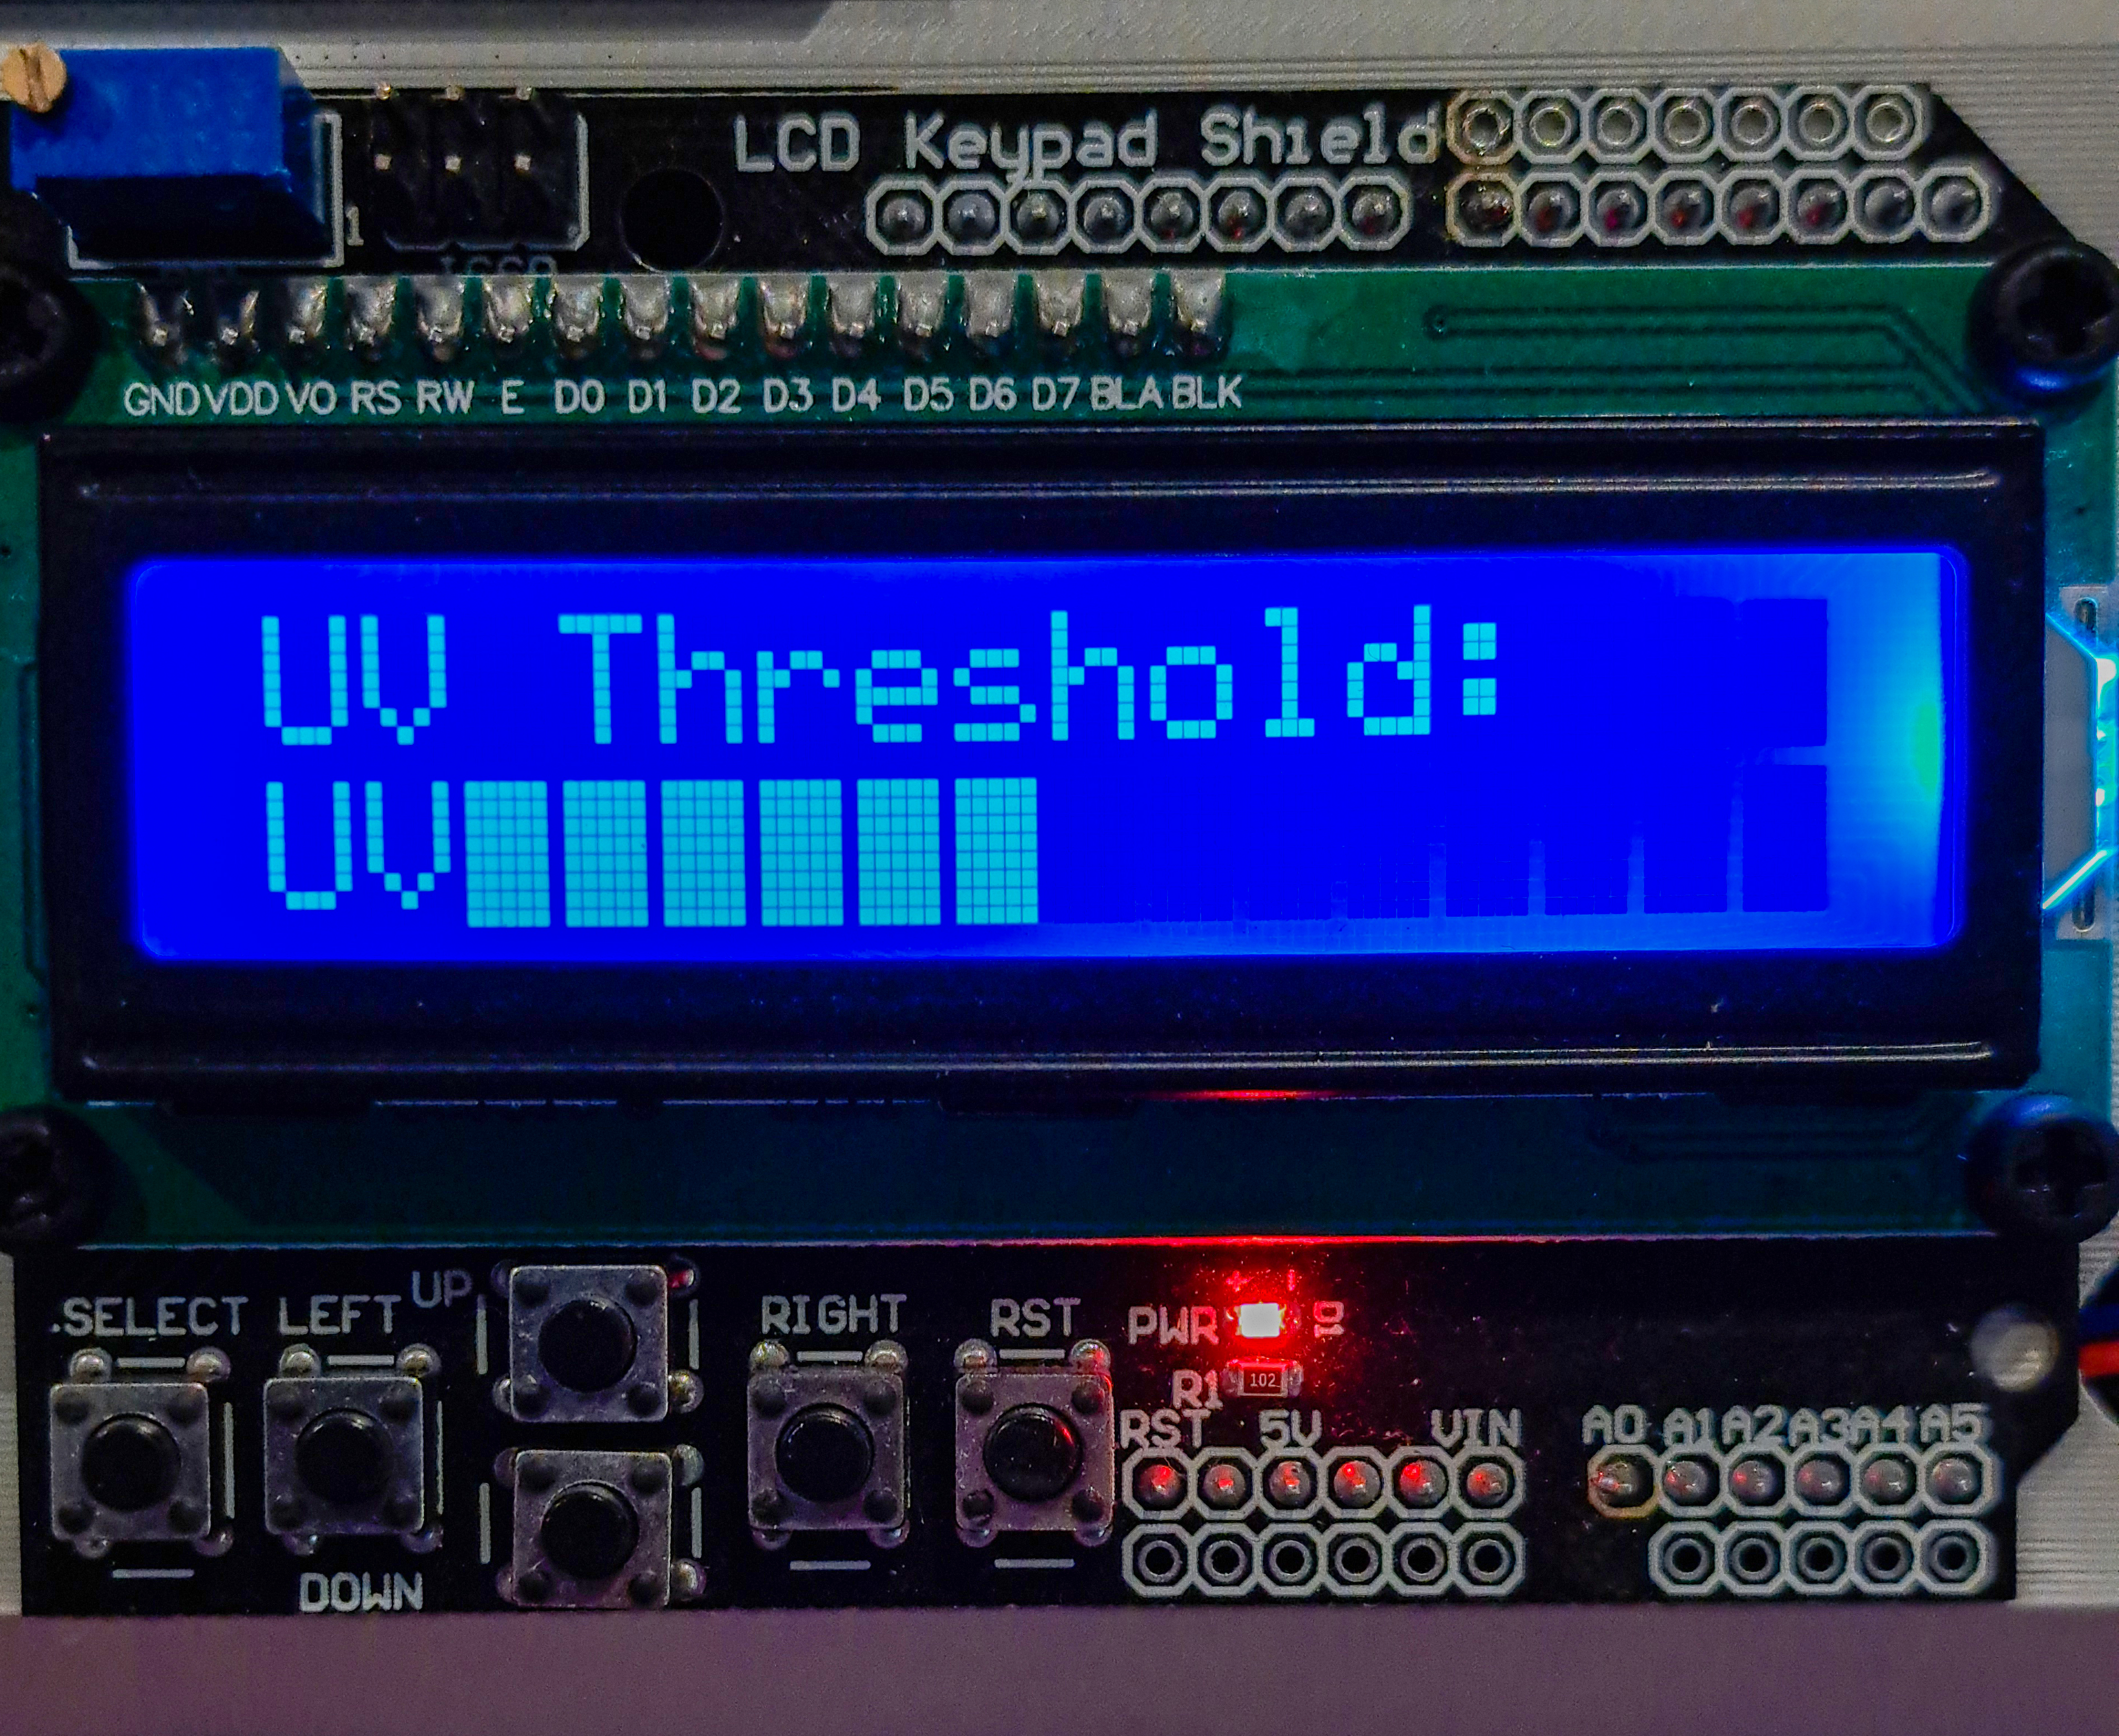
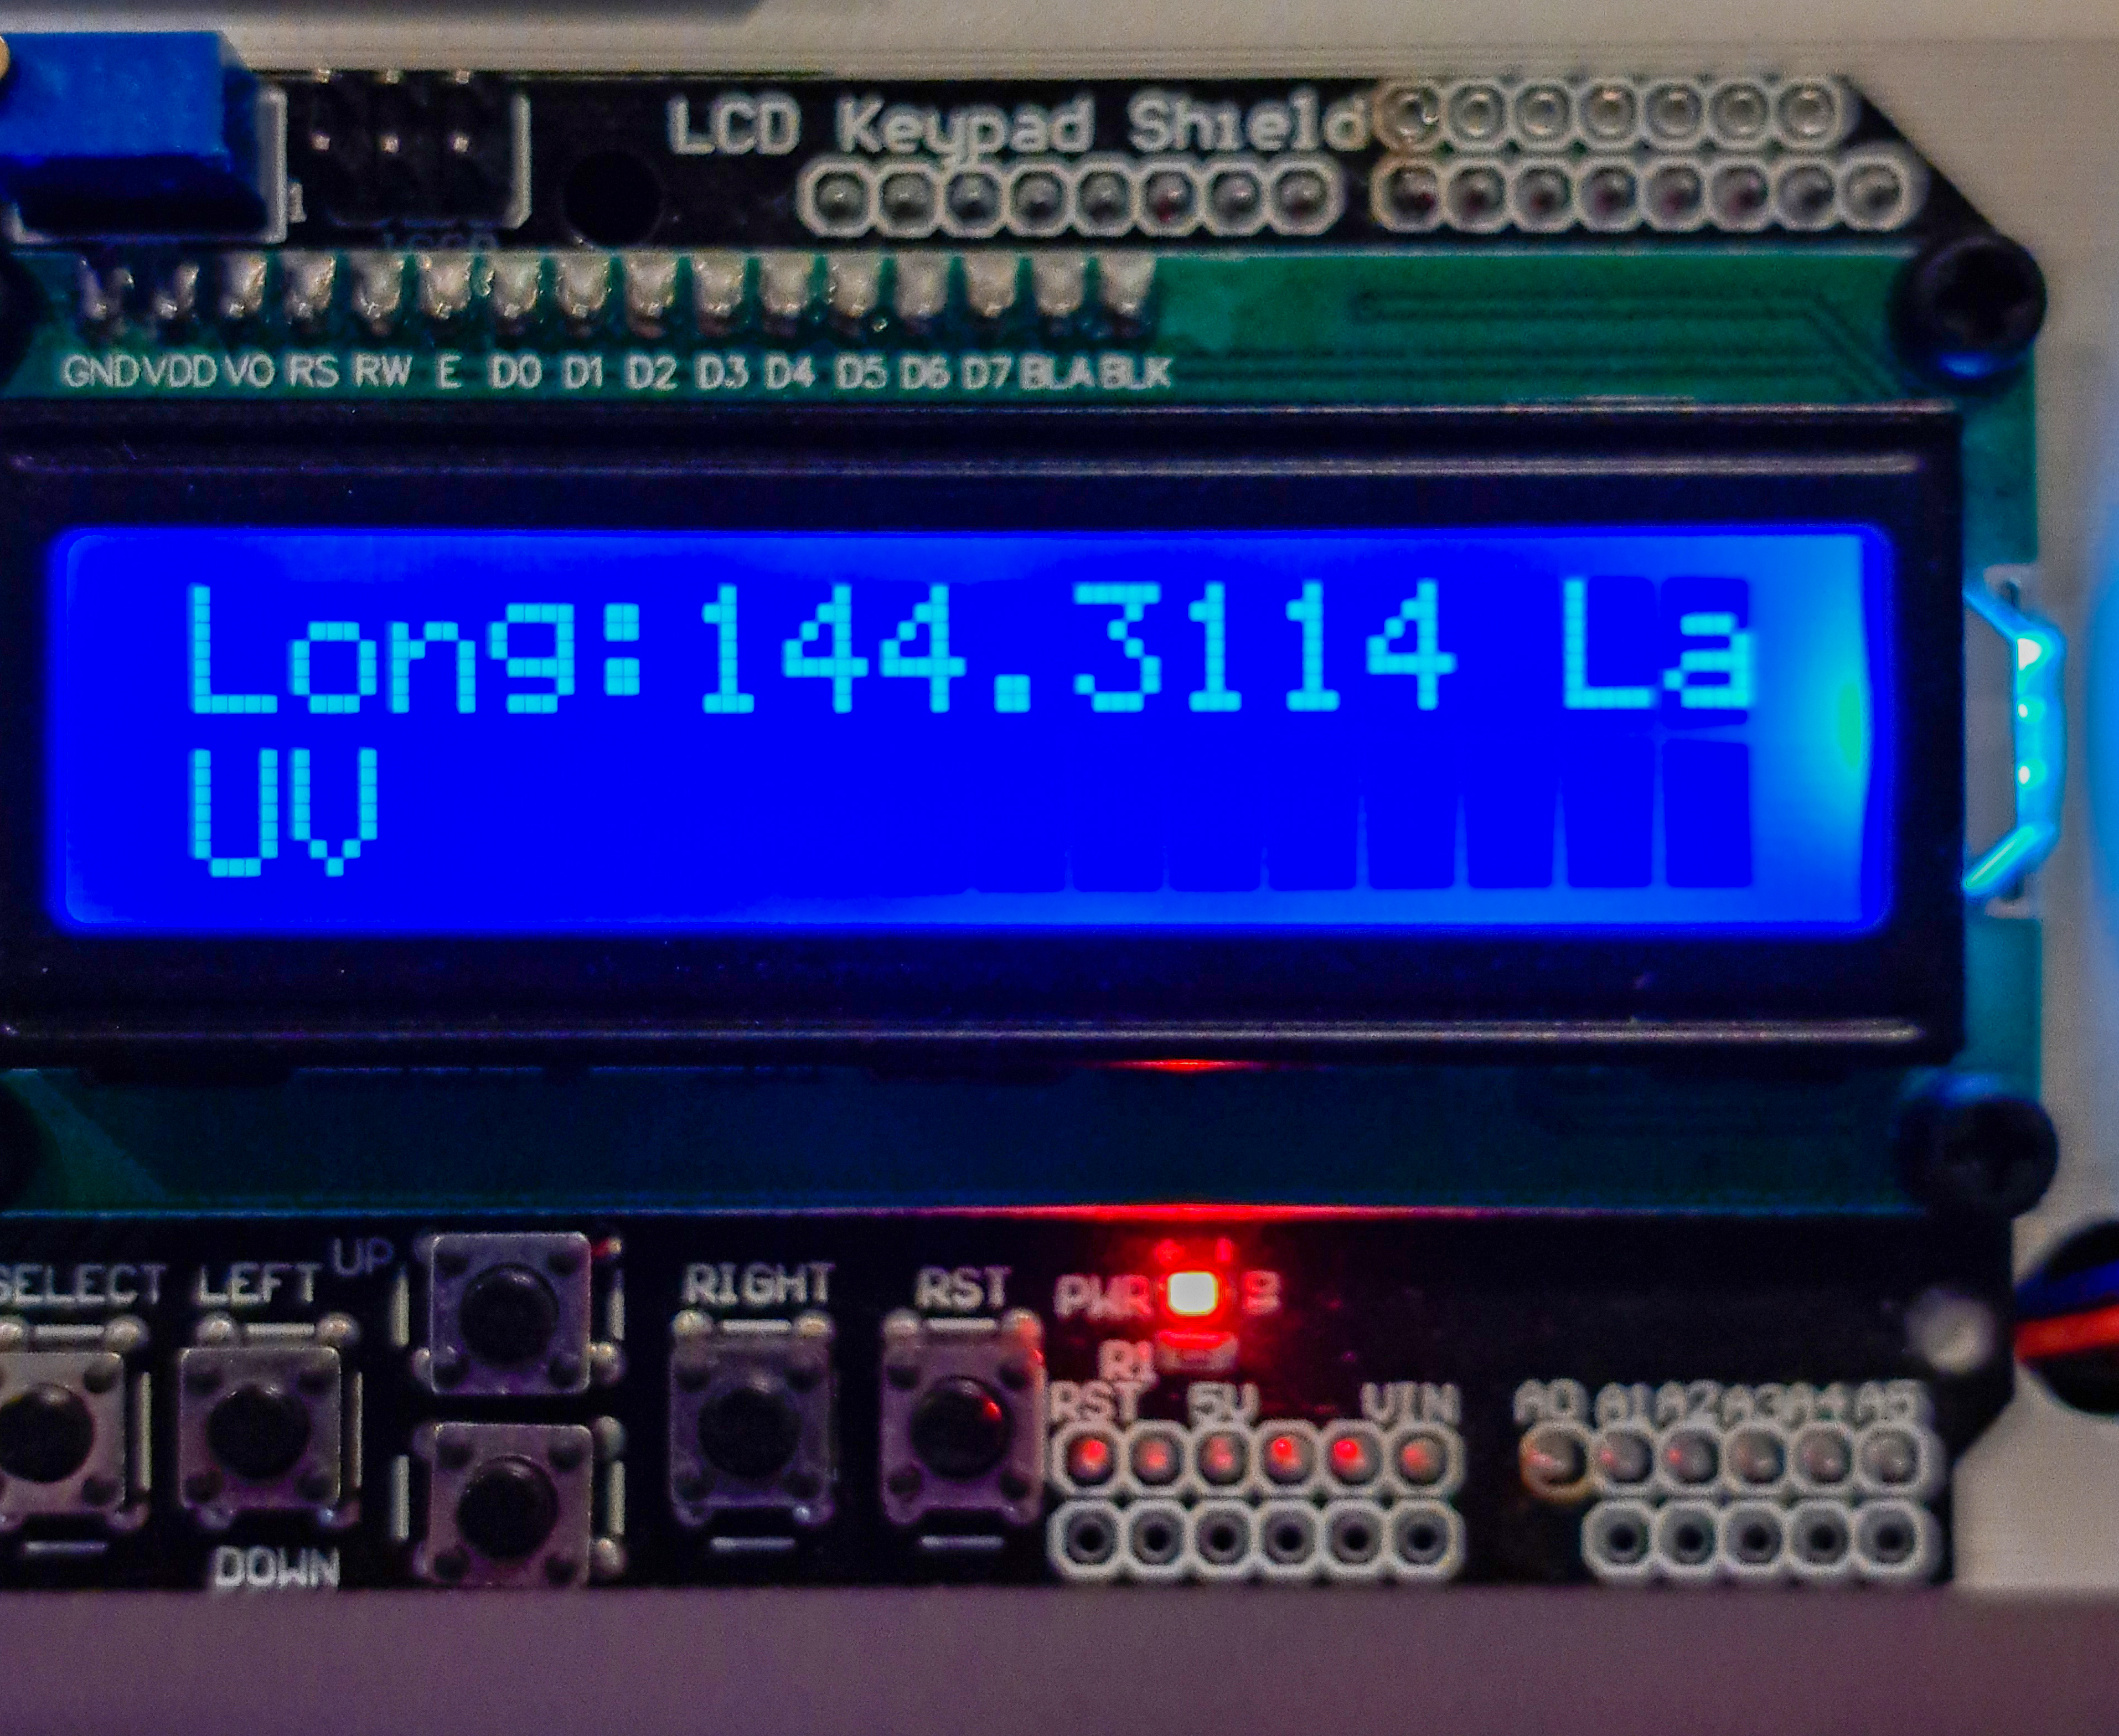
The user interface was built around a 16x2 LCD screen and button input. The station included multiple display screens, including an introduction screen, a main sensor screen, a UV threshold screen, and an additional sensor screen.
The LCD interface allowed the device to present sensor readings and system information directly to the user. The UV threshold could also be adjusted using the LCD button interface, giving the station a more interactive embedded systems feel rather than acting as a simple passive logger.
Button input was handled through analog readings on a single ADC pin. Different voltage ranges corresponded to different buttons, allowing the code to classify user inputs and change the active screen or threshold setting.
Radar Station Enclosure
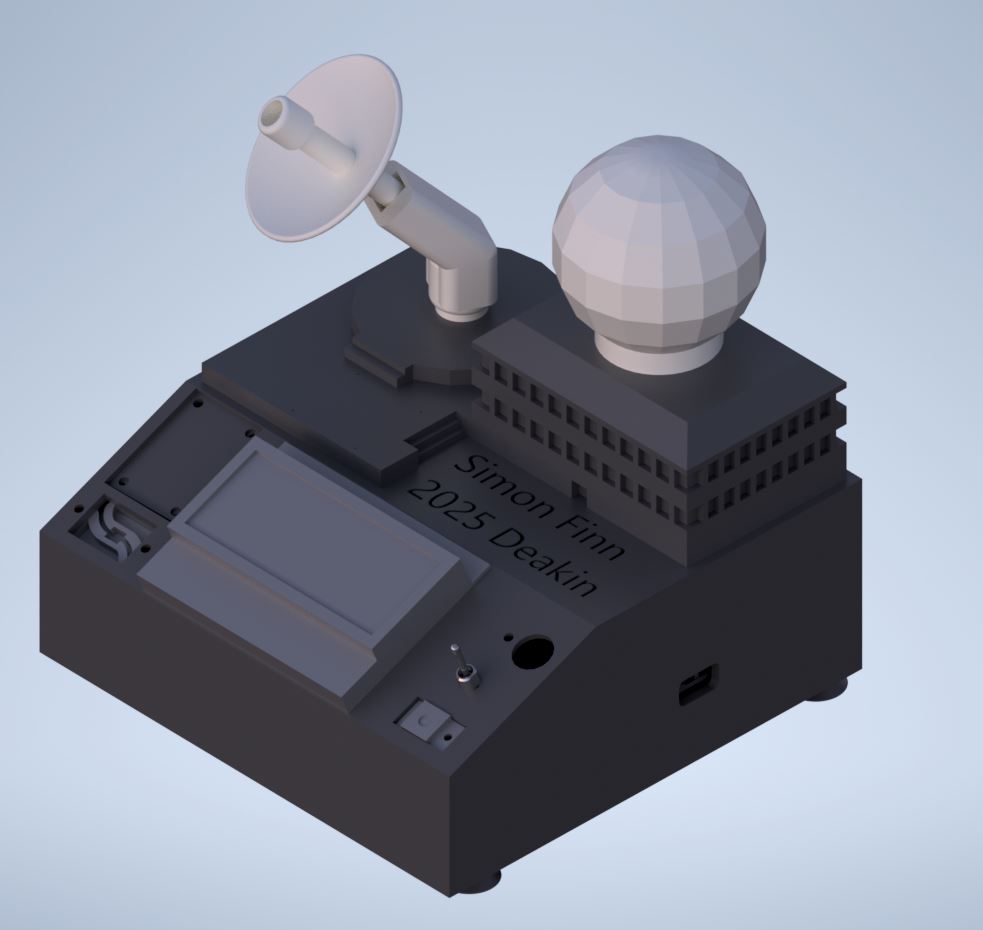
The enclosure was designed to make the project feel like a complete embedded product rather than a loose collection of modules. The station was inspired by weather radar facilities and included a radar dome, moving satellite dish, compact body, and magnetically attached lid.
The enclosure also helped organise the electronics and protect the internal wiring. Access through the lid made the design more practical for maintenance, especially if a sensor or module needed to be replaced later.
A small servo was used to actuate the satellite dish prop. This was one of the project's X-factor features, adding a visual and mechanical element while still remaining connected to the embedded control system.
Custom PCB Integration
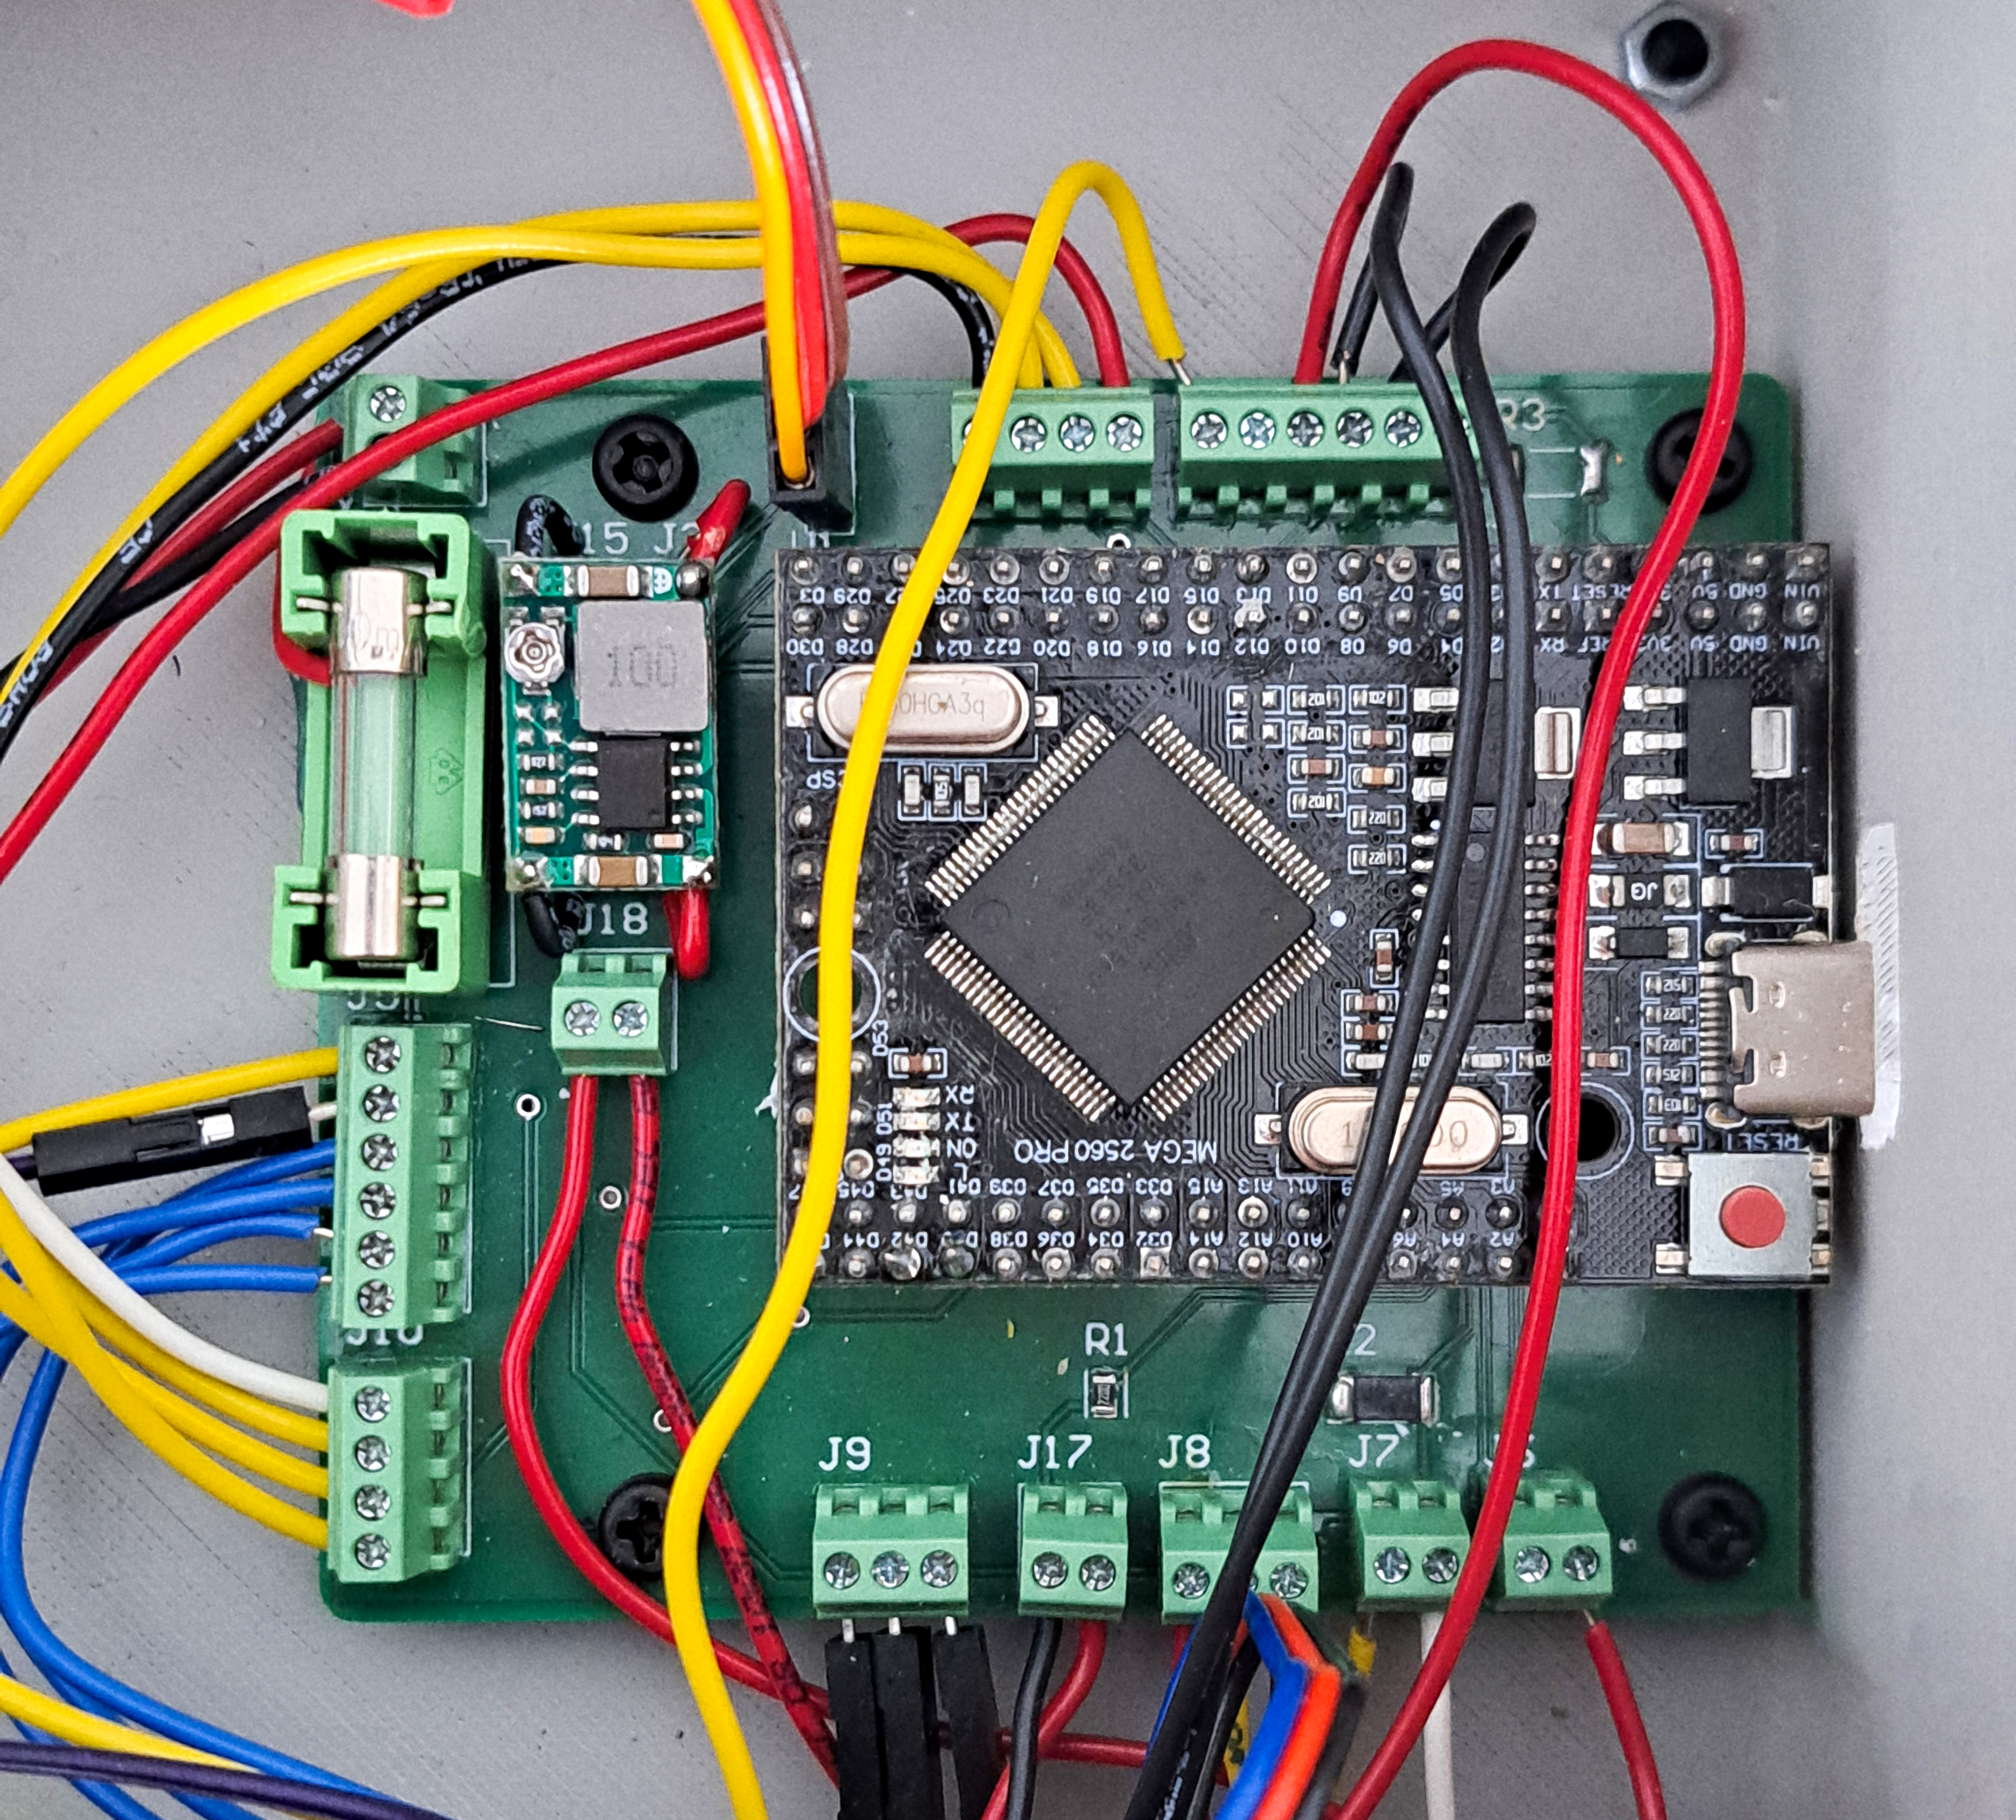
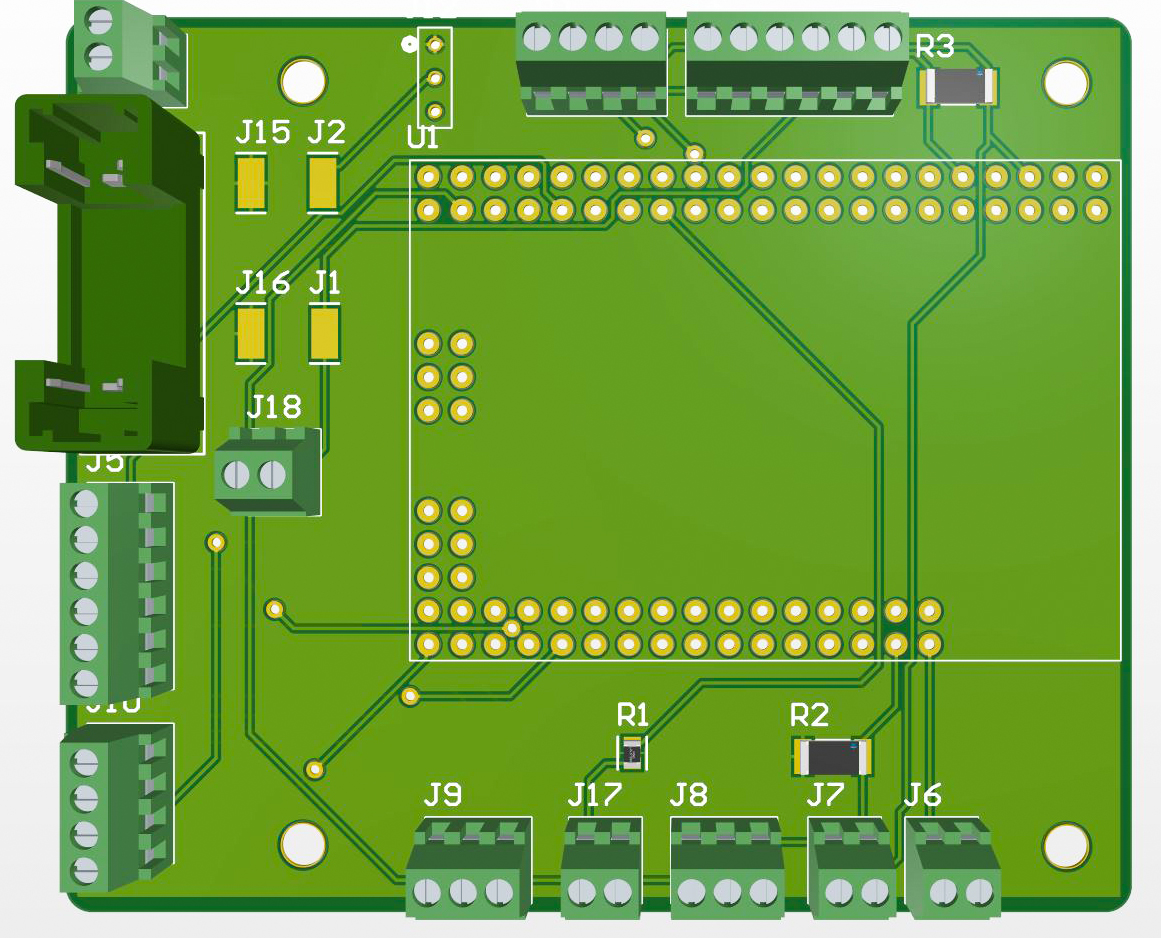
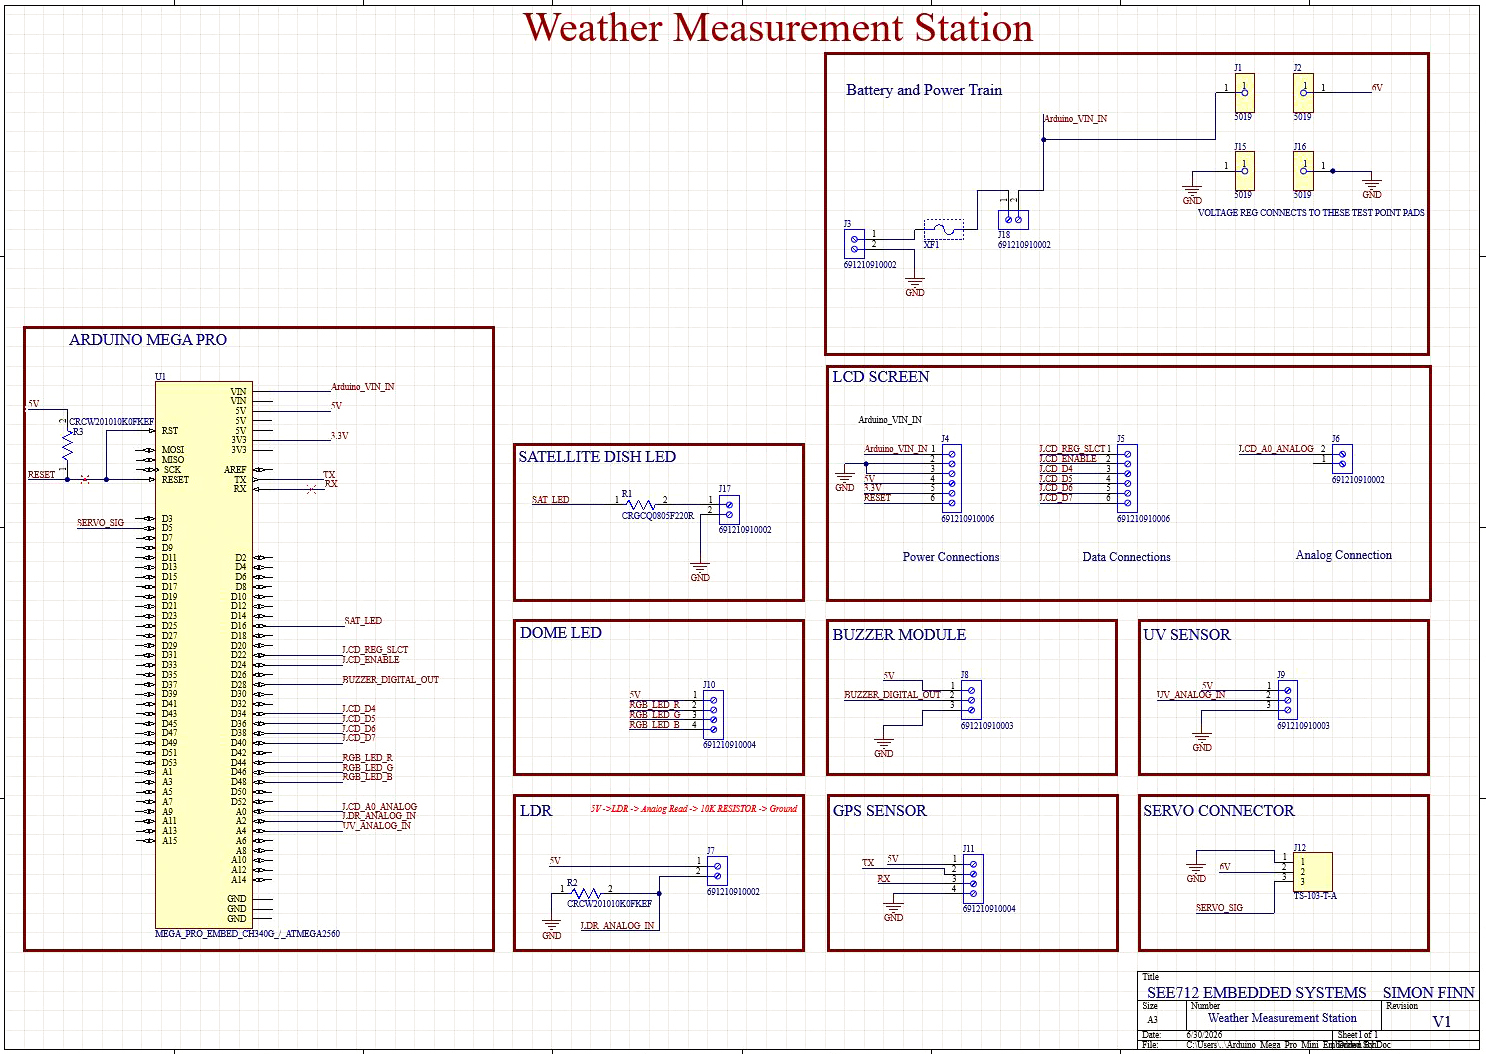
A custom PCB was designed in Altium to simplify the wiring between the Arduino Mega Pro and the external sensors, display, power connections, and supporting components. This made the final device cleaner and easier to assemble than a breadboard or fully hand-wired layout.
The PCB helped turn the project into a more complete embedded system by providing a repeatable wiring structure and improving the physical organisation of the electronics inside the enclosure.
Technical Development
Software Architecture
The software was written through the Arduino IDE and structured around a state-machine approach. This improved code legibility and helped organise the system into separate responsibilities such as initialisation, timekeeping, sensor reading, screen handling, data logging, and user input.
The program used a timer-based interrupt that fired every 1 second. This interrupt updated timing flags, allowing the main state machine to run time-based events when required without congesting the main loop.
The main loop also maintained GPS character decoding so that location and timestamp data could remain available while the rest of the station continued running its user interface and logging routines.
Timer-driven task scheduling
ISR(TIMER1_COMPA_vect)
{
  Startup_Counter++;
  _1_Second_Counter++;
  _2_Second_Counter++;
  _10_Second_Counter++;
  _60_Second_Counter++;
}

void Time_Keeping(void)
{
  if (_1_Second_Counter >= 1)  _1_Sec_Event = true;
  if (_2_Second_Counter >= 2)  _2_Sec_Event = true;
  if (_10_Second_Counter >= 10) _10_Sec_Event = true;
  if (_60_Second_Counter >= 60) _60_Sec_Event = true;
}
Button Input and Screen Logic
Rather than using separate digital inputs for every button, the LCD shield used a resistor ladder connected to one ADC channel. The firmware classified each button by comparing the measured ADC value against expected voltage ranges, then routed the input into the active screen state.
This input method was used to change display screens and adjust the UV threshold value. The code also included screen timeout behaviour, so the UV threshold screen could be shown temporarily before returning to the previously selected screen.
The display logic then used the current screen state to decide what information should be written to the LCD. This included introductory information, UV readings, GPS data, threshold settings, servo position, and lighting conditions.
LCD button decoding through one ADC input
ADMUX = (ADMUX & 0xF0) | 0x00;
ADCSRA |= (1 << ADSC);

while (ADCSRA & (1 << ADSC));
adc_value = ADC;

if      (adc_value < 50)  current_button = RIGHT;
else if (adc_value < 195) current_button = UP;
else if (adc_value < 380) current_button = DOWN;
else if (adc_value < 555) current_button = LEFT;
else if (adc_value < 790) current_button = SELECT;
else                      current_button = NO_PRESS;
Screen state and UV threshold control
switch (current_button)
{
  case UP:
    UV_Threshold++;
    CurrentScreen = SCREEN_UV_THRESHOLD;
    ThresholdDisplayActive = true;
    break;

  case DOWN:
    UV_Threshold--;
    CurrentScreen = SCREEN_UV_THRESHOLD;
    ThresholdDisplayActive = true;
    break;

  case LEFT:
    CurrentScreen = SCREEN_MAIN;
    break;

  case RIGHT:
    CurrentScreen = SCREEN_SECONDARY;
    break;
}
Sensor Reading and Data Logging
Sensor feedback was handled by reading analog values and converting them into values that could be displayed, logged, and interpreted. The UV sensor was used to estimate the UV index, while the LDR produced a light level value based on the measured analog input.
GPS data provided timestamp and location information, allowing each logged measurement to be tied to a time and place. The station periodically saved longitude, latitude, time, light level, and UV level.
Data was stored onboard, with EEPROM capacity limiting the size of the dataset. The final testing approach used periodic sampling throughout the day, then exported the results for plotting and analysis in MATLAB.
UV sensor conversion
ADMUX = (ADMUX & 0xF0) | 0x04;
ADCSRA |= (1 << ADSC);

while (ADCSRA & (1 << ADSC));
uint16_t raw_adc = ADC;

float uv_index = 0.05 * raw_adc - 1.0;

if (uv_index > 14.0) uv_index = 14.0;
if (uv_index < 0.0)  uv_index = 0.0;

UV_Value = uv_index;
UV_Value_Int = (int)(uv_index + 0.5);
LDR light-level scaling
ADMUX = (ADMUX & 0xF0) | 0x02;
ADCSRA |= (1 << ADSC);

while (ADCSRA & (1 << ADSC));
uint16_t raw_adc = ADC;

LDR_Reading = (raw_adc * 4.88) / 1000.0;
Light_Level = ((LDR_Reading - 0.05) / (3.1 - 0.05)) * 100.0;

if (Light_Level > 100) Light_Level = 100;
if (Light_Level < 0)   Light_Level = 0;
EEPROM log record format
// Each log entry used 5 bytes:
// UV, light level, GPS day, GPS hour, GPS minute

unsigned char uv     = (unsigned char) UV_Value_Int;
unsigned char light  = (unsigned char) Light_Level;
unsigned char day    = (unsigned char) gps.date.day();
unsigned char hour   = (unsigned char) gps.time.hour();
unsigned char minute = (unsigned char) gps.time.minute();

Save_Log_To_EEPROM(uv, light, day, hour, minute);
Project Outcome
Data Collection and Results
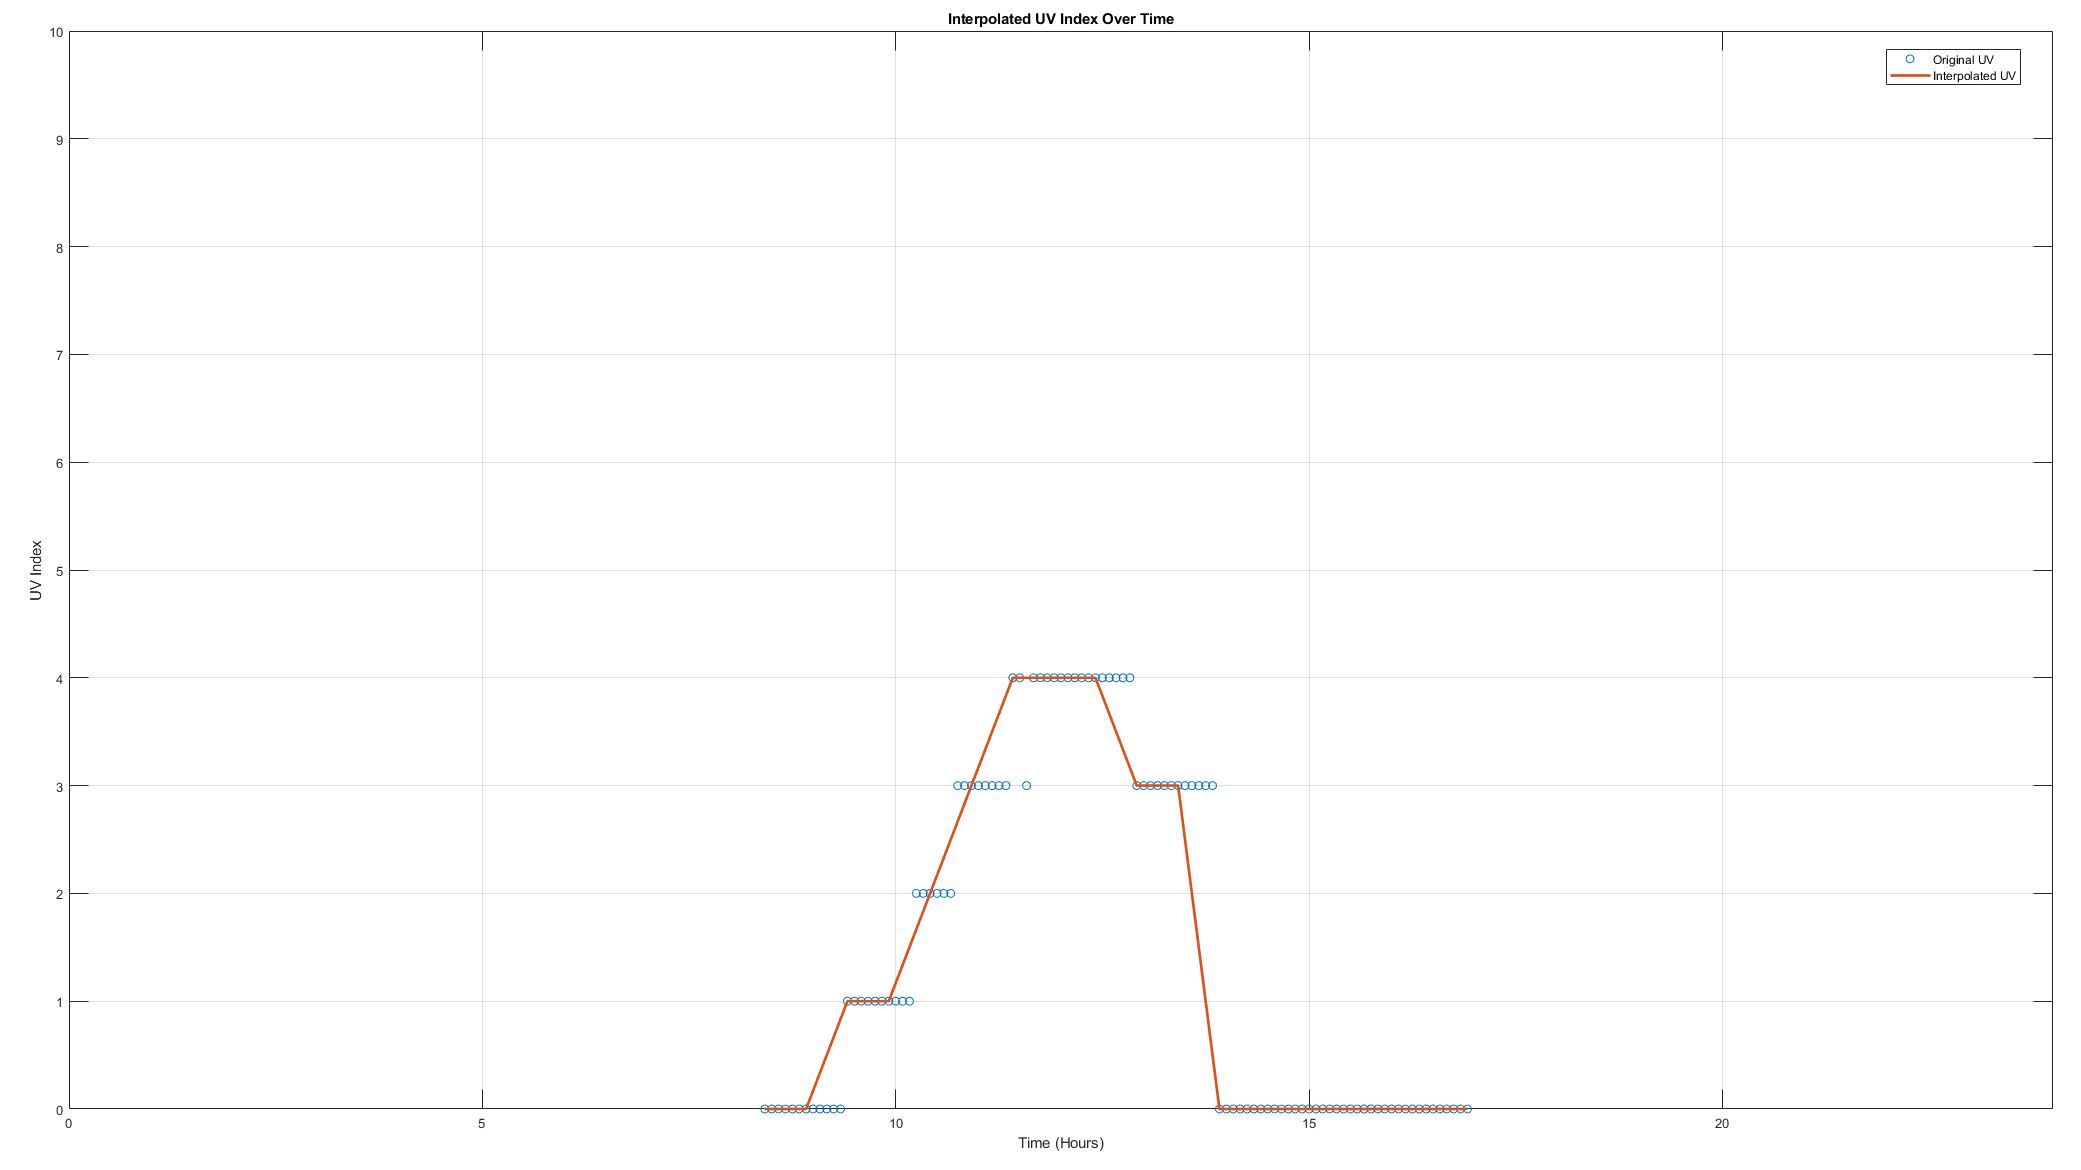
The station was tested by collecting UV readings every 5 minutes between approximately 9:00 am and 4:00 pm on an overcast autumn day. This provided a more useful spread of measurements than the initial three-point test, allowing the change in UV level over time to be plotted and reviewed in MATLAB.
The recorded UV trend followed the expected daily pattern, starting low in the morning, increasing toward the middle of the day, and then reducing again through the afternoon. Although the conditions were overcast, the readings still showed a clear rise and fall across the test period.
For context, the Bureau of Meteorology forecast listed the UV index as 3 for the day. The station readings were broadly consistent with this low-to-moderate UV condition, although some variation was expected due to cloud cover, sensor angle, enclosure placement, and rounding of the measured UV index.
Light Level Limitation
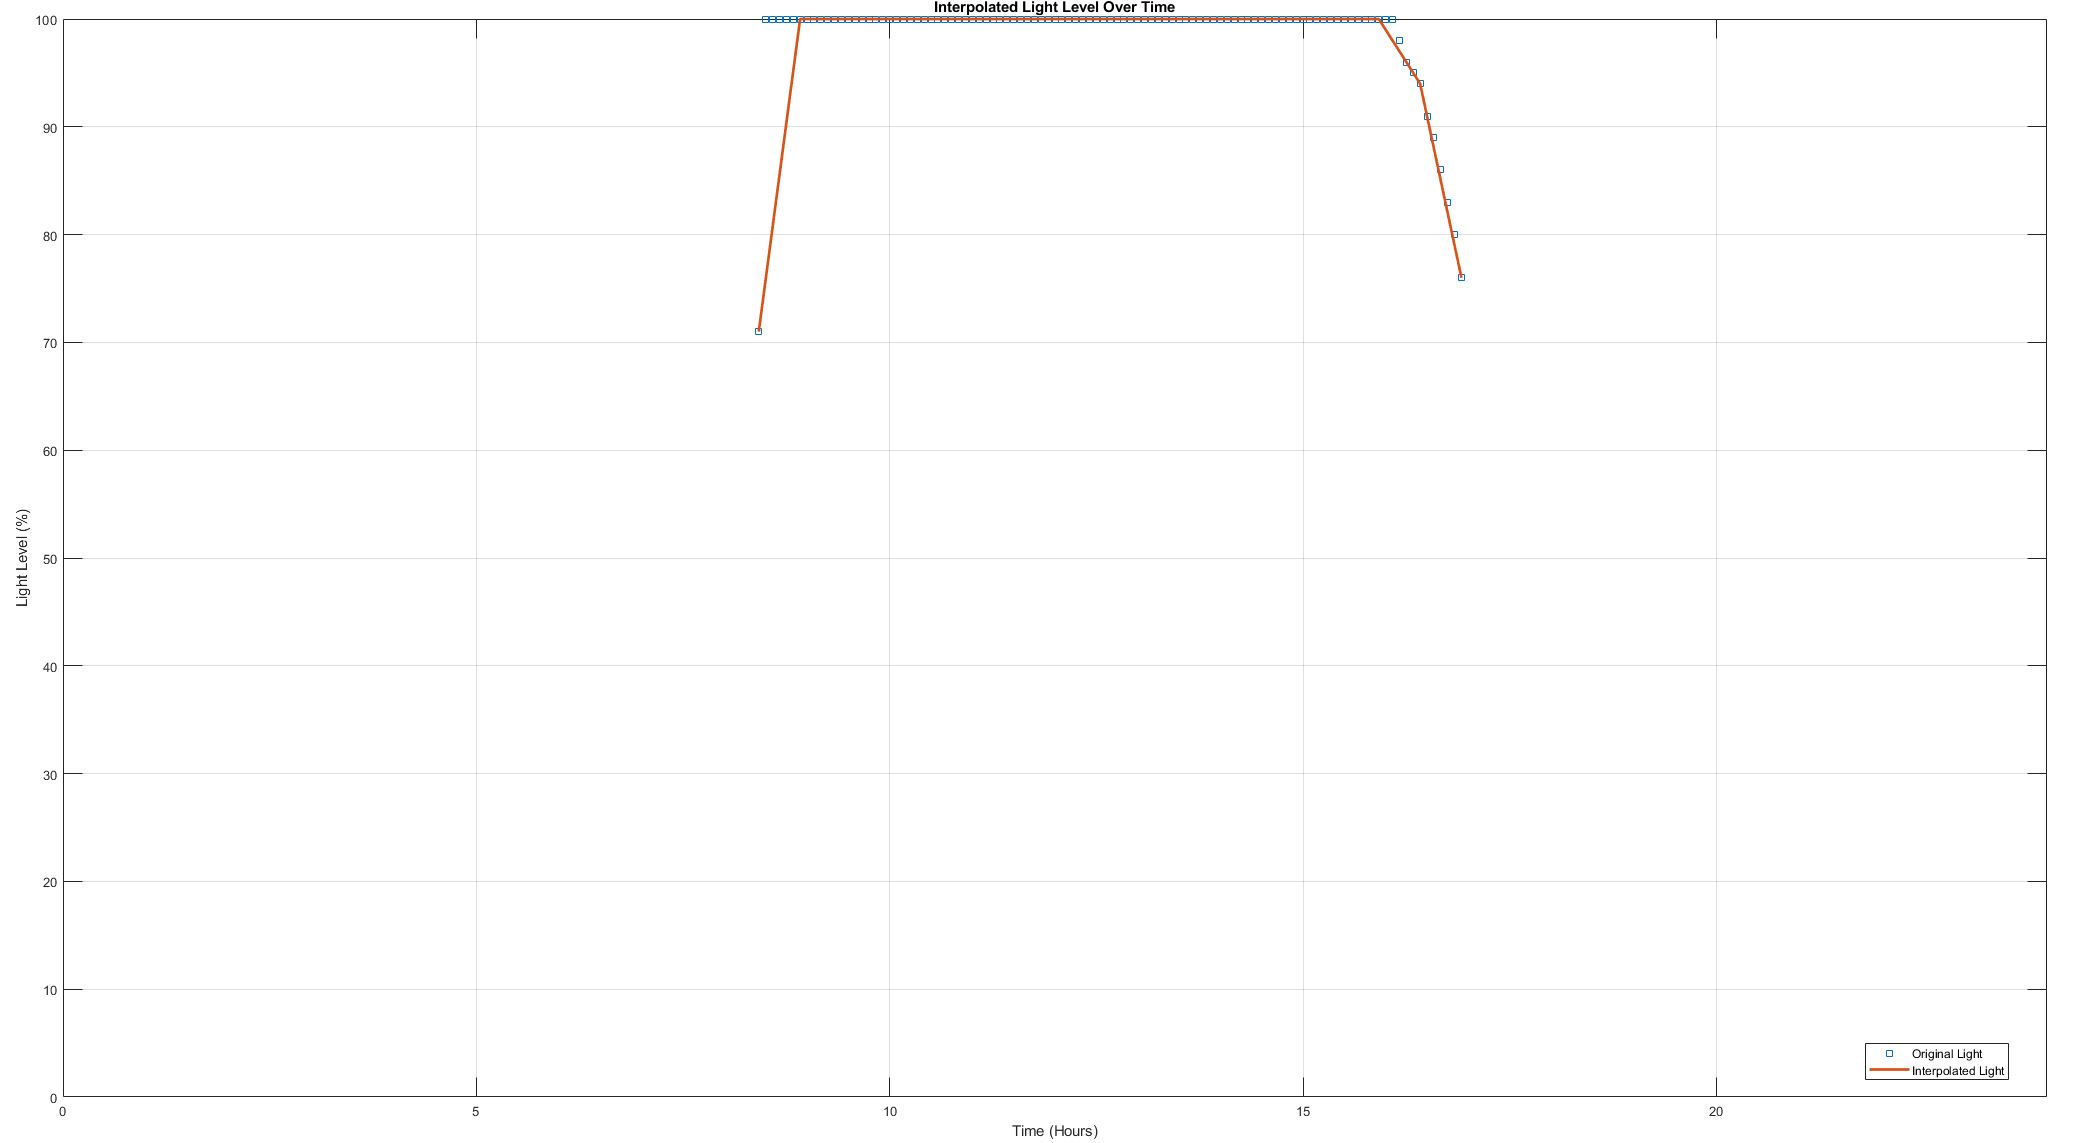
The light level data was less successful than the UV data. The LDR readings plateaued too quickly because of the hard-coded threshold ranges, which prevented the system from capturing a useful spread of changing light conditions throughout the day.
Although the light level graph did show a drop later in the afternoon as sunset approached, the calibration was not refined enough to produce the kind of detailed daily light profile originally intended.
This limitation was still useful from an engineering perspective because it showed the importance of calibration, scaling, and selecting threshold values that match the real operating environment rather than just a controlled bench test.
What I Would Improve
If I were to revisit this project, the first improvement would be the light sensor calibration. The LDR threshold range should be tuned using a wider set of real outdoor lighting conditions so the data does not plateau so quickly.
I would also improve the outdoor protection of the enclosure. The LCD screen became hot in direct sunlight, so a small cover, shield, or recessed mounting arrangement would help protect the display during longer outdoor testing.
A future version could also include more storage or an external data export method, allowing the station to collect larger datasets over multiple days without being limited by onboard EEPROM capacity.
Project Reflection
Overall, this project successfully produced a working compact embedded monitoring station. It combined real sensor integration, low-level C programming, user input, LCD display control, GPS data, onboard logging, custom PCB design, mechanical packaging, and MATLAB-based analysis.
The project was especially useful because it connected embedded software with a physical product. The final result was not just code running on a microcontroller, but a portable device that could be placed outdoors, collect data, present information to the user, and support later analysis.
Embedded Programming
Arduino C, state-machine design, timer interrupts, LCD control, analog input handling, GPS decoding, and EEPROM data logging.
Sensor Integration
UV sensing, LDR light measurement, GPS timestamping, analog conversion, threshold calibration, and user-facing data display.
Hardware Design
Custom PCB integration, compact wiring layout, 2S LiPo power, switch and fuse protection, and modular component placement.
Product Development
CAD enclosure design, radar-station-inspired aesthetics, servo actuation, magnetic lid access, and outdoor usability testing.